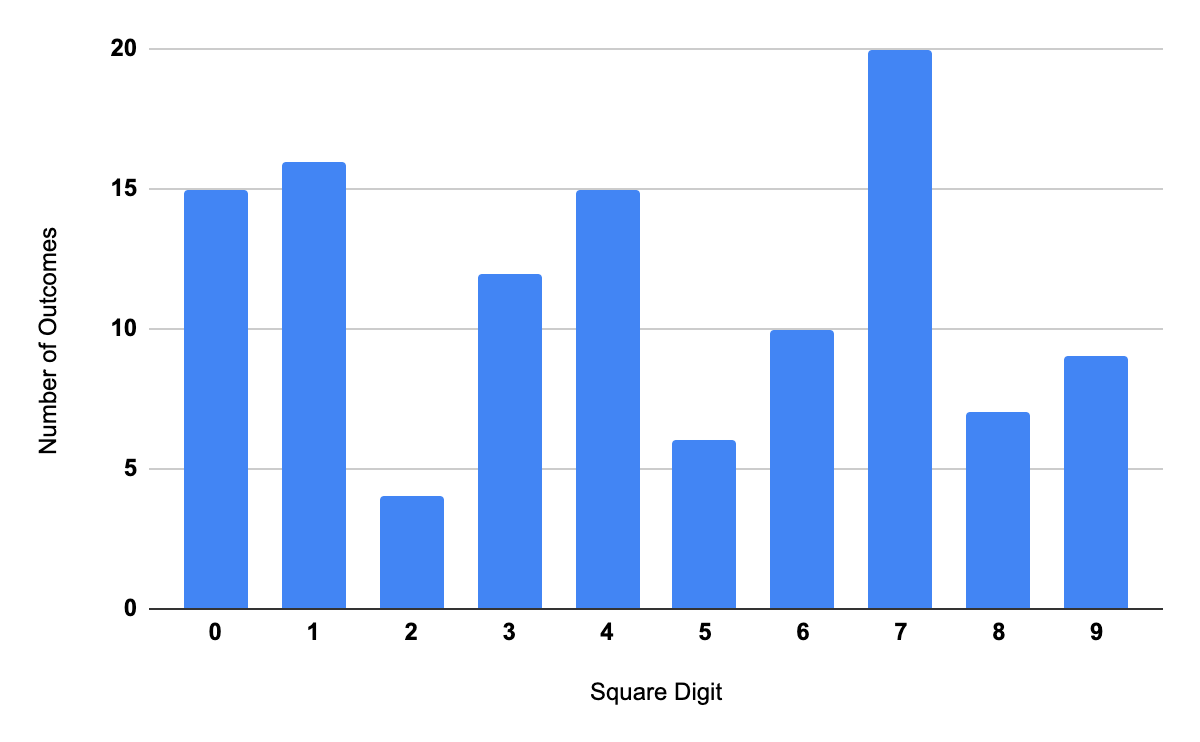
There are a considerable amount of statistics on the Internet around football squares (or super bowl squares). The ones that matter the most are below and provide some of the odds around final scores as well as frequency of numbers getting 'hit' the most.
| # | 0 | 1 | 2 | 3 | 4 | 5 | 6 | 7 | 8 | 9 |
|---|---|---|---|---|---|---|---|---|---|---|
| Hits | 15 | 16 | 4 | 12 | 15 | 6 | 10 | 20 | 7 | 9 |
| Percentage | 13.2% | 14% | 3.5% | 10.5% | 13.2% | 5.3% | 8.8% | 17.5% | 6.1% | 7.9% |
©2025 iamsquare.net - disclaimer